Streamlining OpenClaw: Introducing the Web Configuration Dashboard
Introducing the Web Configuration Dashboard for Opencalw
Configuration shouldn’t be a chore. Until now, setting up OpenClaw meant diving deep into terminal commands and manual file edits. We’ve changed that.
We are introducing the OpenClaw Dashboard — a browser-based interface designed to get you out of the console and into the action. No more “terminal friction” or syntax headaches; everything you need to fine-tune your agent is now just a click away.
Purchasing Openclaw
Head to xNode site and select “Openclaw”
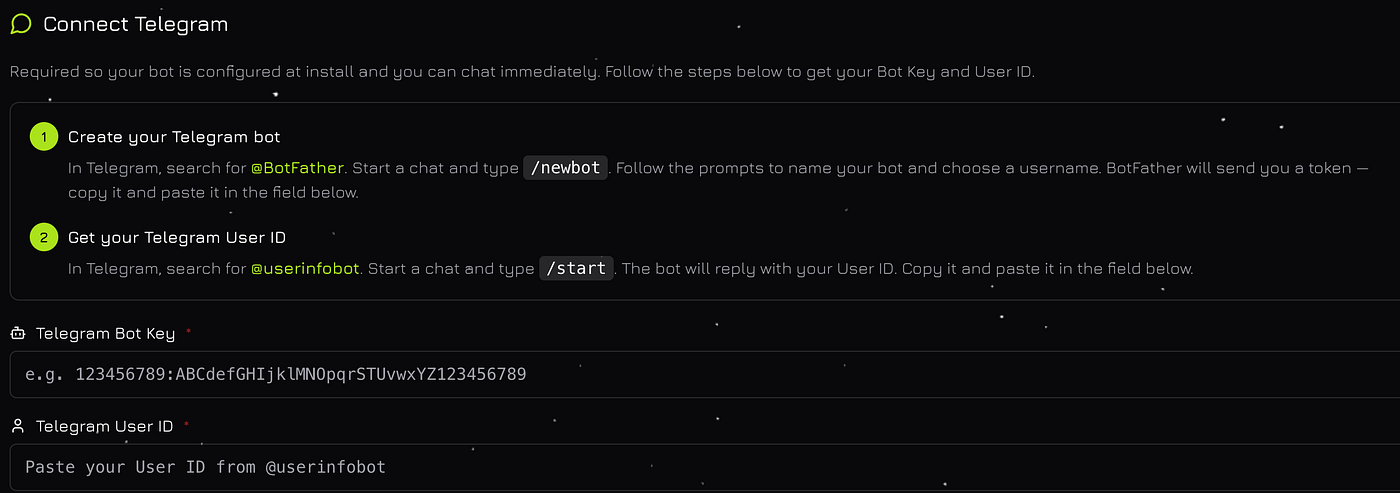
Set up Telegram according to the instructions on the website
Next the automatic installation of Openclaw will begin (it will take 2 minutes). After that, you’ll be able to customize it to your needs in our dashboard. More on that below.
Dashboard Overview: What’s Under the Hood?
The new interface centralizes every critical aspect of your OpenClaw instance. Here is a breakdown of the key sections:
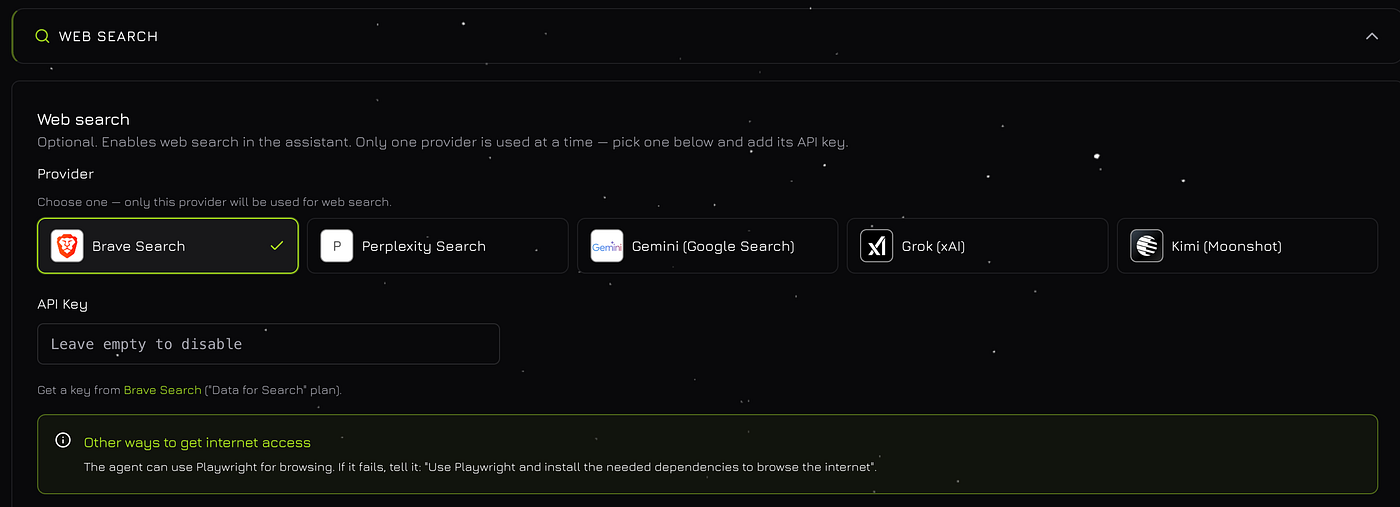
1. Web Search
Give your agent eyes on the live internet. In this section, you can toggle web search capabilities and select your preferred provider (such as Brave or Kimi). It’s optional, but essential if you need real-time data beyond the model’s training cutoff.
2. Skills (ClawHub)
OpenClaw is only as powerful as the tools it can use. The Skills section integrates with ClawHub. While you still use the CLI to install new capabilities, this tab allows you to manage and verify which skills are currently active and ready for use.
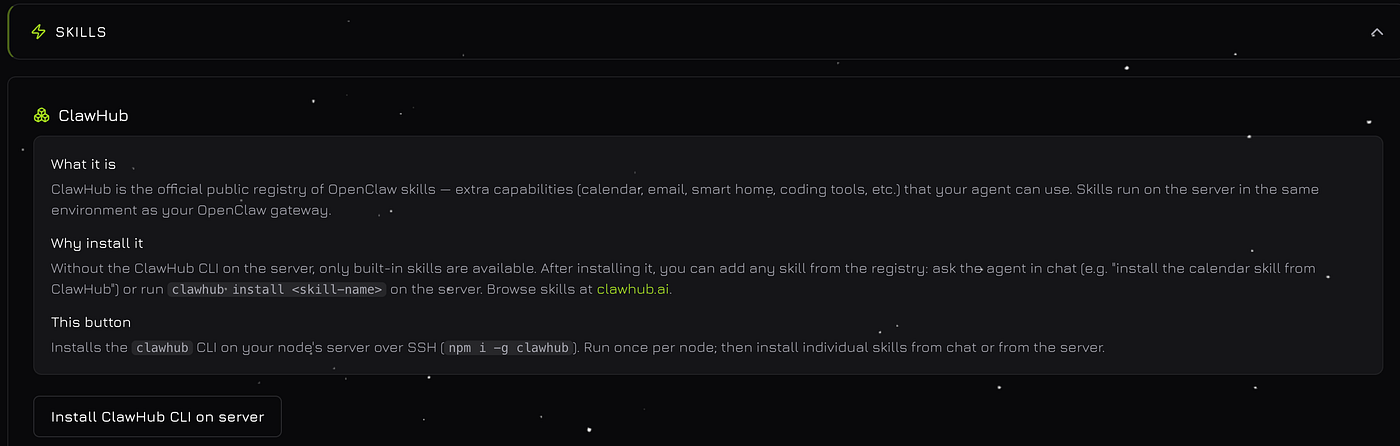
Think of Skills as “plug-and-play” modules that give your OpenClaw agent the ability to interact with the real world. Instead of just talking, the agent can now perform actions across local system and cloud services. Through ClawHub, you can browse and install specialized skill sets that turn a standard LLM into a powerful automation engine.
Software Development & DevOps:
Git/GitHub: Allow the agent to clone repositories, create branches, and push code changes.
Docker & K8s: Grant the agent the ability to manage containers, inspect logs, and monitor cluster health.
Terminal Execution: A sandboxed environment where the agent can run scripts, install dependencies, and debug system issues.
Workflow Automation:
Communication: Connect to Slack, Discord, or Telegram to send updates, create alerts, or summarize channel discussions.
Productivity: Integrate with Google Calendar or Jira to manage schedules, track tickets, and update project status.
Database Access: Give the agent read/write access to SQL (PostgreSQL, MySQL) or NoSQL (MongoDB) databases for data analysis.
Advanced Web & Data:
Browser Automation: Using tools like Puppeteer or Playwright, the agent can navigate complex websites, take screenshots, and scrape data behind logins.
File Management: Allow the agent to organize files, convert document formats (PDF to Text), and manage local storage.
How it works: While the Dashboard provides a visual overview of your active capabilities, new skills are added via the ClawHub CLI. Once installed, they appear here automatically, ready to be utilized by the agent in your session.
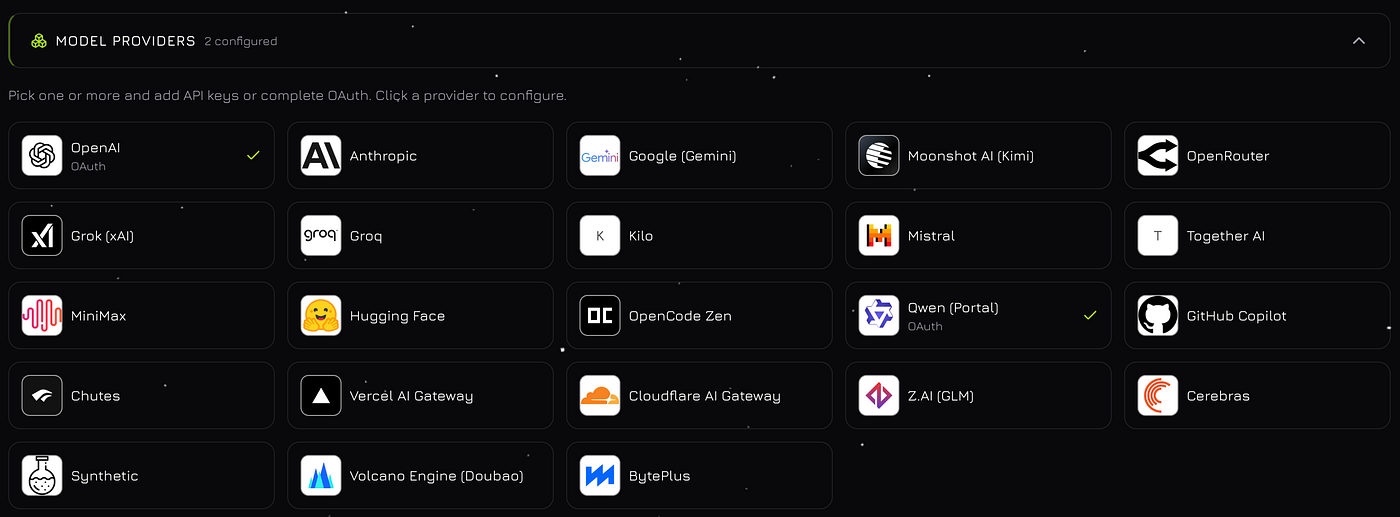
3. Model Providers
This is the “brain” of your setup. We currently support 23 different providers, allowing you to swap between OpenAI, Anthropic, Gemini and more. You can see at a glance how many are configured and quickly add credentials for new ones.
How to use it?
Let’s link your account using OpenAI as an example. Click “Use a different account”
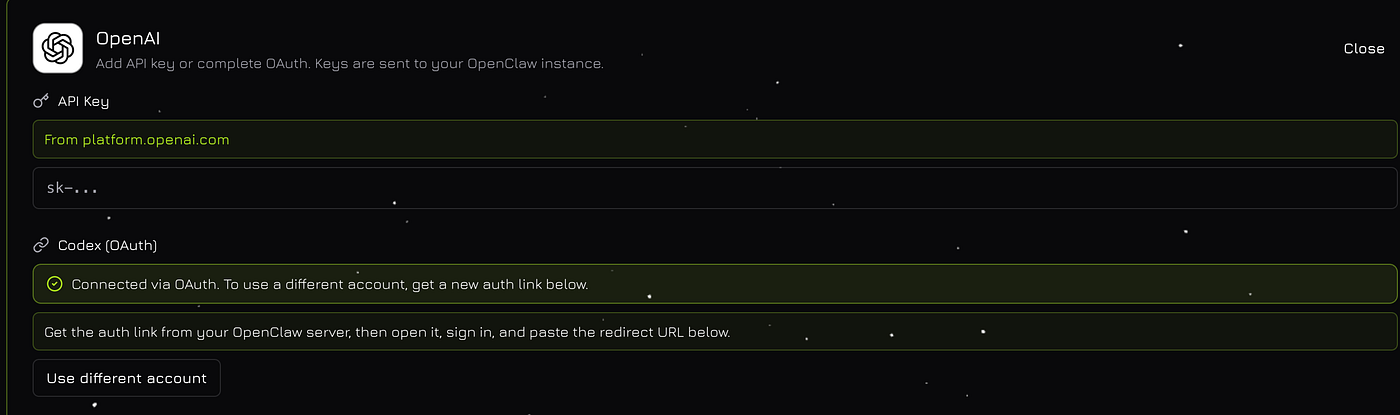
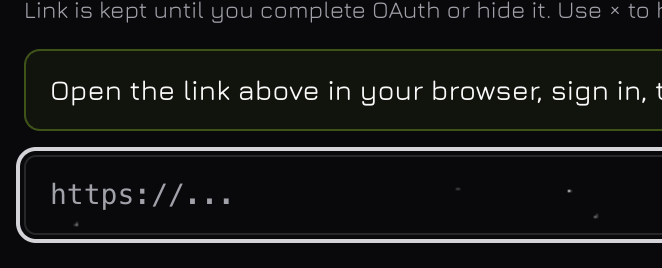
Open the link in your browser and sign in
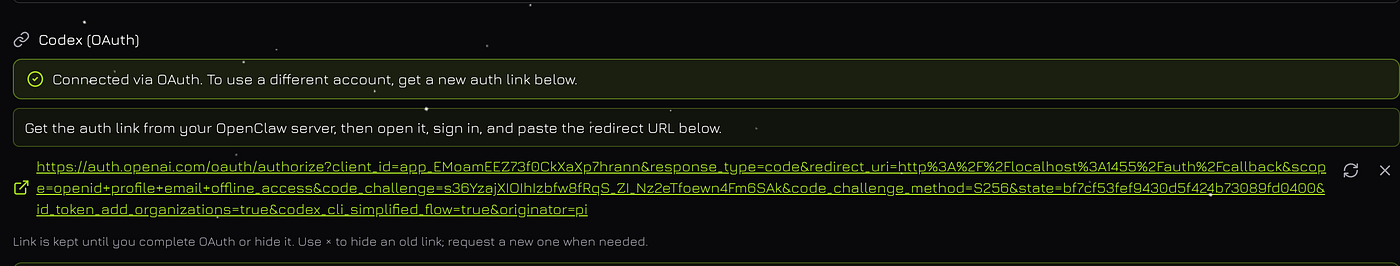
Copy the full URL from your browser’s address bar after redirect

Paste it here and click Save
It is crucial to understand that every provider operates under its own specific constraints:
Usage Quotas: Most providers limit your RPM (Requests Per Minute) and TPM (Tokens Per Minute).
Subscription Tiers: Your limits often scale with your account “Tier.” For example, a new OpenAI account (Tier 1) has significantly lower capacity than a seasoned enterprise account (Tier 5).
Billing Models: Some providers offer free quotas allowances, while others require prepayment, and still others bill you at the end of the month. Always make sure your account has a positive balance to avoid service interruptions.
Common API Errors & What They Mean:
Even with a perfect setup, you will eventually encounter “hiccups” from the provider side. Here is how to read them:
Rate Limit Reached (Error 429): This is the most common error. It means you are sending requests too fast or using too many tokens for your current tier.
The Fix: Wait a few moments before retrying, or upgrade your tier in the provider’s console.
2. Insufficient Quota / Billing Issues: Your API key is valid, but your account balance is zero or your credit card on file was declined.
The Fix: Check your billing dashboard (e.g., OpenAI Platform or Anthropic Console) and ensure you have active credits.
3. Context Window Exceeded: The conversation history has become too long for the model to process in a single “thought.”
The Fix: Clear the current session context or switch to a model with a larger window (like Claude 3.5 Sonnet or GPT-4o).
4. Provider Server Overload (Error 503): This isn’t your fault. The provider’s servers are temporarily overwhelmed or undergoing maintenance.
The Fix: Wait a few minutes or use the OpenClaw Dashboard to quickly switch to a different provider and keep working.
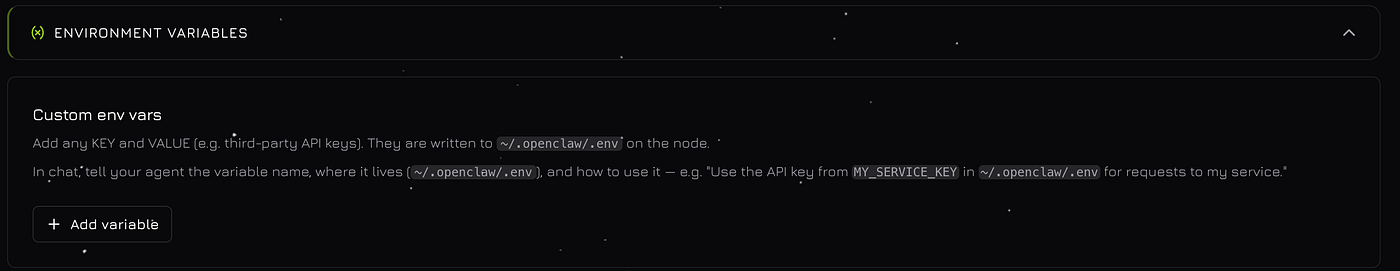
4. Environment Variables
Forget manually editing .env files and risking syntax errors. You can now manage your environment variables directly within the UI. Add, edit, or remove keys securely without ever leaving the browser.
How to use it?
Enter your key name and its value. Then, in Telegram, message Openclaw:
Use the API key from
MY_SERVICE_KEYin~/.openclaw/.envfor requests to my service.
What can you manage here?
System Configuration: Adjust the logging verbosity (e.g.,
LOG_LEVEL=debug) to troubleshoot complex agent behaviors.Database & Storage: If your OpenClaw instance uses external storage, this is where you’d point to your PostgreSQL, Redis, or S3-compatible buckets.
Custom API Keys: Beyond just Model Providers, many Skills (ClawHub) require their own keys — like your GitHub Personal Access Token or a Slack Webhook URL.
Feature Flags: Quickly toggle experimental features on or off without re-deploying the entire stack.
Why use the Dashboard instead of the CLI?
Zero Syntax Errors: The UI handles the formatting for you. No more broken instances because of a missing quote or a trailing space in a text file.
Instant Visibility: You can see exactly which variables are currently loaded into the environment at a glance.
Secure Management: While the variables are stored securely, the Dashboard provides a human-readable way to update them without risk of overwriting the entire configuration file by mistake.
Pro Tip: After adding or modifying an environment variable, remember to use the “Restart Gateway” button at the bottom of the page. This ensures the new settings are injected into the running process immediately.
5. Gateway Token
This token lets you connect apps to your OpenClaw — the web interface (Control UI), desktop or mobile apps, WebChat, and other clients. When an app asks for the gateway token, paste this one. Copy and save it now; it is shown once per request.
💡Important
Gateway token grants full access to your OpenClaw. Do not share it with anyone — not in chats, email, or public places. Treat it like a password.
6. Maintenance & Restart
If the agent stops responding or feels “stuck,” you don’t need to hunt for the process ID in your terminal. Use the Restart Gateway button. It refreshes the system and applies new configurations instantly without wiping your keys or settings.
Stop wrestling with the console. Start building.
💡Need help? Join our Discord for support and updates!